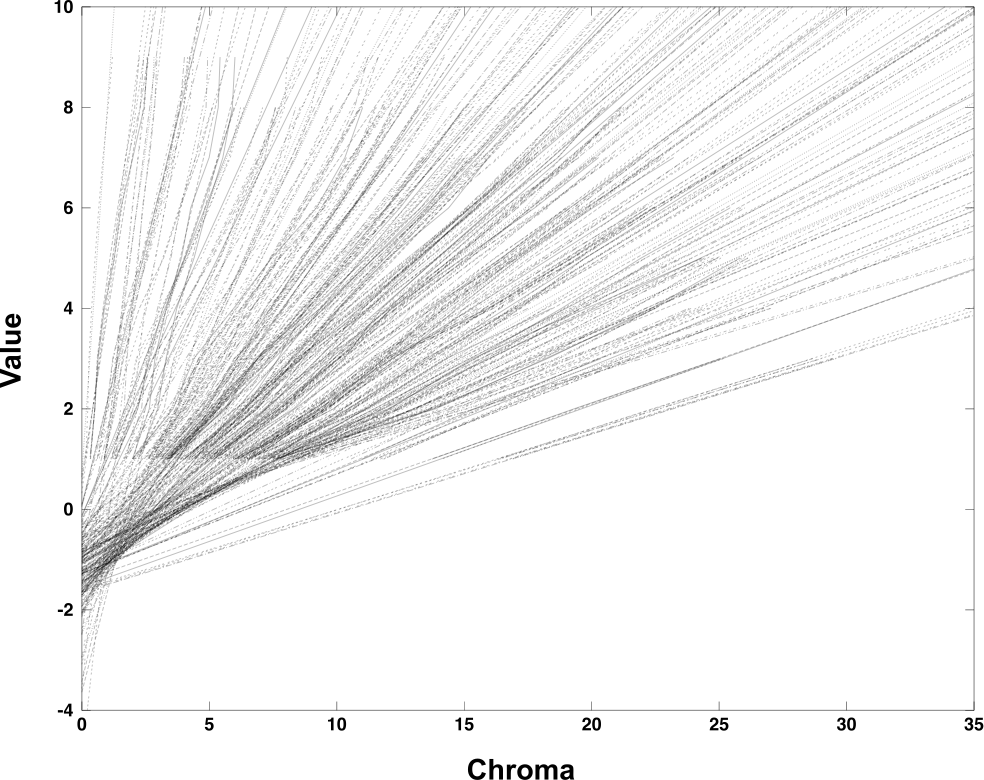
Abstract: Using an inversion of the Munsell renotation, this paper calculates that a colour's shadow series is approximately a straight line in the Munsell system. The line starts at the colour's Munsell specification and ends about one value step below N0, on the neutral axis. The colour's hue in shadow shifts slightly towards the yellow part of the spectrum. The calculations suggest that ideal black belongs at about N(-1) in the Munsell system, rather than at N0, if equality of perceptual steps is to be maintained. Similarly, ideal white should be slightly lighter than N10.
The picture (Fig. 4 of the article) shows 182 shadow series, along with approximating least squares lines, plotted in terms of their values and chromas, but disregarding hue, in the Munsell system.
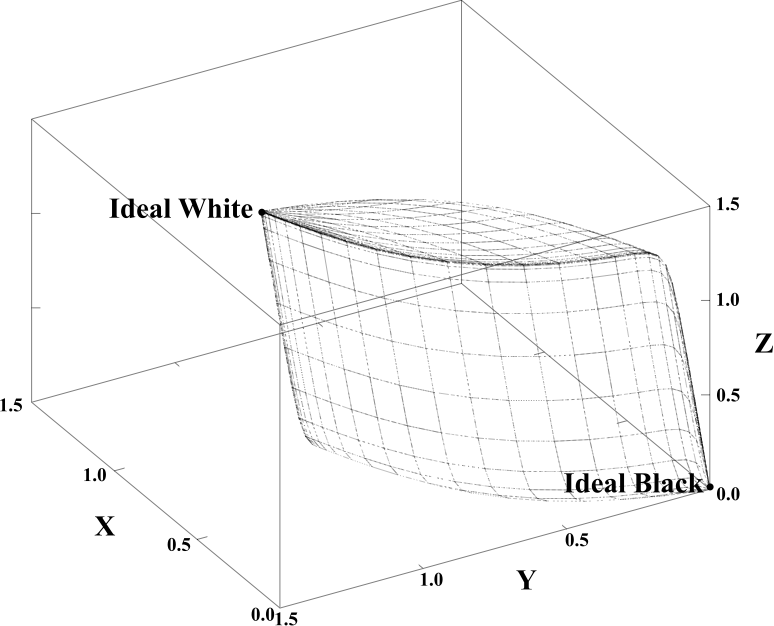
Abstract: This paper demonstrates that the CIE XYZ colour solid is a zonoid. An approximating zonohedral colour solid is constructed explicitly from a set of generating vectors, which are integrals of colour-matching functions over narrow intervals of the visible spectrum. The zonohedral approach yields an intuitive, constructive proof of the Optimal Colour Theorem: the reflectance function of an optimal colour takes on only the values 0 or 1, with at most two transition wavelengths. In addition, zonohedral techniques can simplify computations: for example, optimal colours can be found without calculating transition wavelengths. Finally, zonohedra provide a simple, unified approach to colour space, and eliminate much of the confusion arising from chromaticity diagrams.
The picture (Fig. 9 of the article) shows the Illuminant C colour solid.
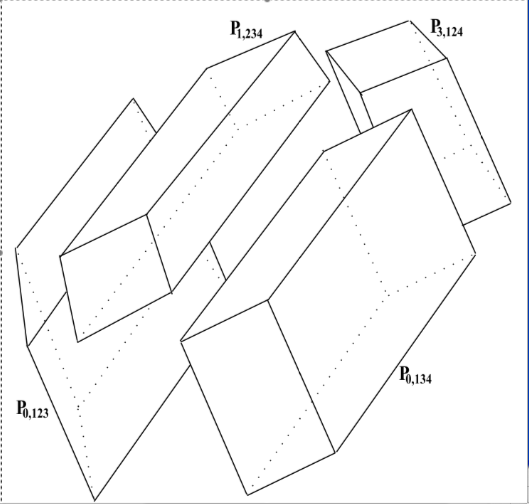
Abstract: In a display with more than three primaries (called a multi-primary display), a color can be expressed as multiple combinations (called control sequences) of primaries. This paper presents an algorithm for assigning control sequences, that preserves current assignments when further primaries are added. We call these control sequences extensible. It is shown that the gamut of any number of primaries is a zonohedron, which can be dissected into parallelepipeds. Control sequences are assigned within each parallelepiped. The current parallelepipeds remain when more primaries are added, so the current assignments are preserved. Multi-primary displays can also cause unwanted metamerism, and make continuous color scales appear discontinuous. The algorithm avoids these problems. When viewed through natural filters, such as yellowed ocular lenses, multi-primary displays can sometimes make two different colors appear identical. If the primaries satisfy the Binet-Cauchy criterion, which is always the case when all primaries are monochromatic, then these spurious matches are avoided.
The picture (Fig. 4 of the article) shows a dissection of a zonohedral gamut, resulting from four primaries, into parallelepipeds.
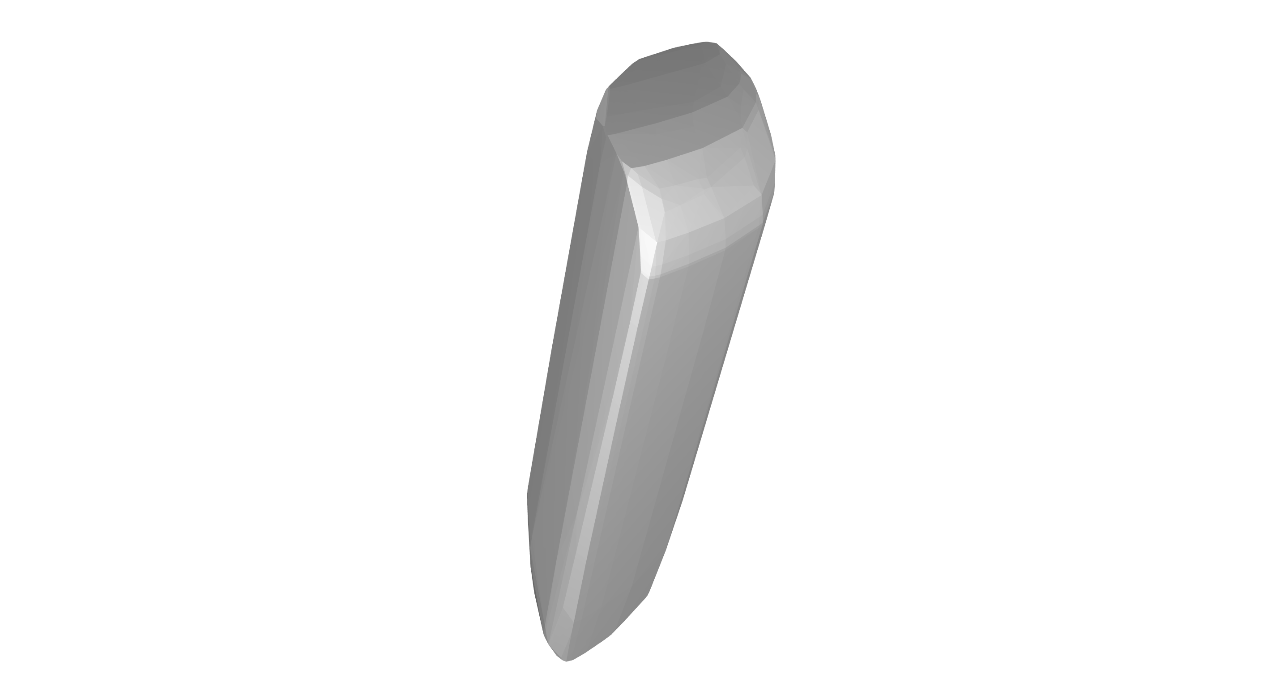
Abstract: An object colour's CIE XYZ coordinates can change when it is viewed under different illuminants. The set of XYZ coordinates for all object colours, which is called the object-colour solid, likewise varies under different illuminants. This paper shows that, despite these changes, some properties are invariant under illuminant transformations. In particular, as long as the illuminant is nowhere zero in the visible spectrum, optimal colours take the same Schrödinger form, and no two optimal colours are metameric. Furthermore, all object-colour solids have the same shape at the origin: they all fit perfectly into the convex cone (which we will call the spectrum cone) generated by the spectrum locus. The spectrum cone, itself, does not vary when the illuminant changes. The object-colour solid for one illuminant can be transformed into the solid for another illuminant, by an easily visualized sequence of expansions and contractions of irregular rings, called zones.
The picture (Fig. 4 of the article) shows an example of a zone around the object-colour solid for a simplified illuminant.
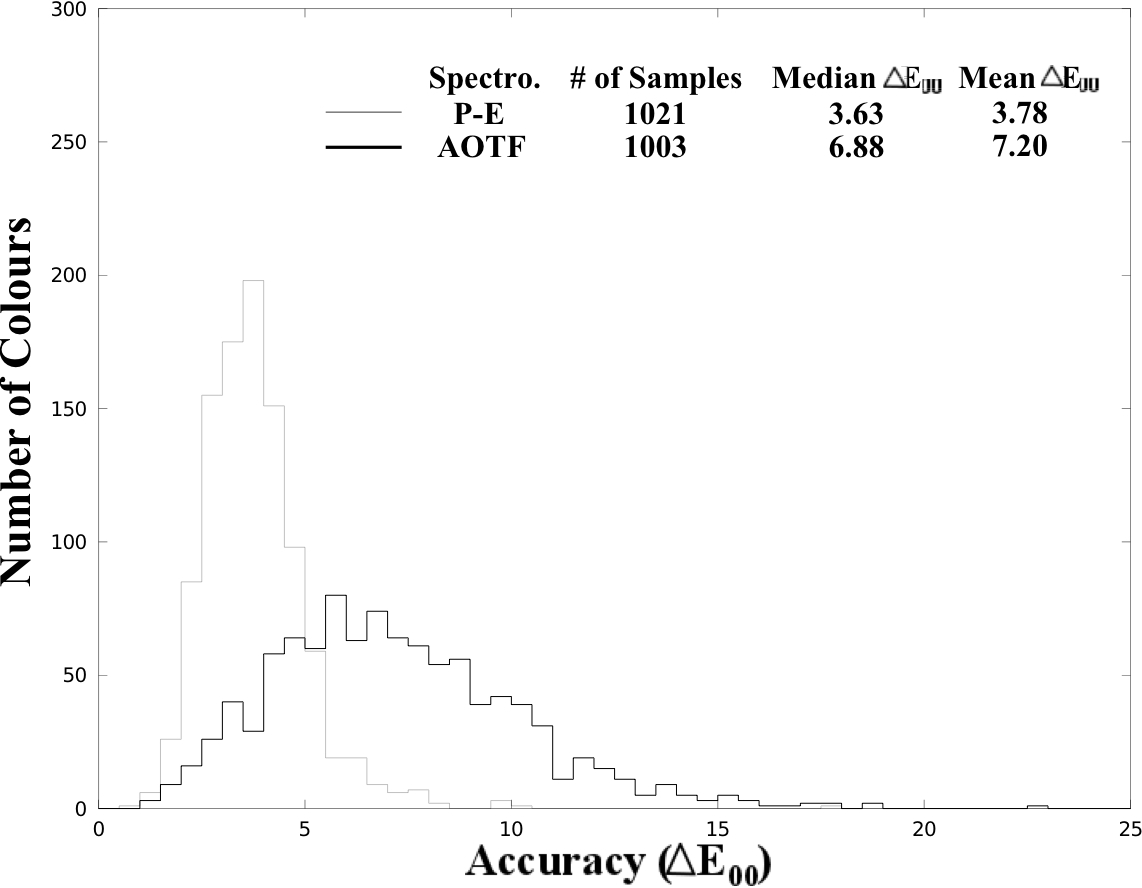
Abstract: The University of Joensuu's measurements of the 1976 Munsell Book are one of the few publicly available sets of spectral reflectance measurements of Munsell samples. This article evaluates colour differences between the printed Munsell matte samples and the 1943 renotation standard. The median difference was found to be 3.6 or 6.9 CIEDE2000 units, depending on which spectrophotometer was used for the measurements. Furthermore, the Munsell values of the printed samples showed strong biases relative to the renotation, as did some of the hues and chromas. By comparison, the median differences for two Munsell books produced after 2000 are between 1.5 and 2.0, and all the individual Munsell components are bias-free. Their deviations from the standard suggest that Joensuu's measurements are not a sound basis for further analysis of the Munsell system.
The picture (Fig. 1 of the article) shows the colour differences (with respect to CIEDE2000) between the Joensuu measurements of the 1976 Munsell Book of Color---Glossy Finish and the 1943 Munsell renotation standard
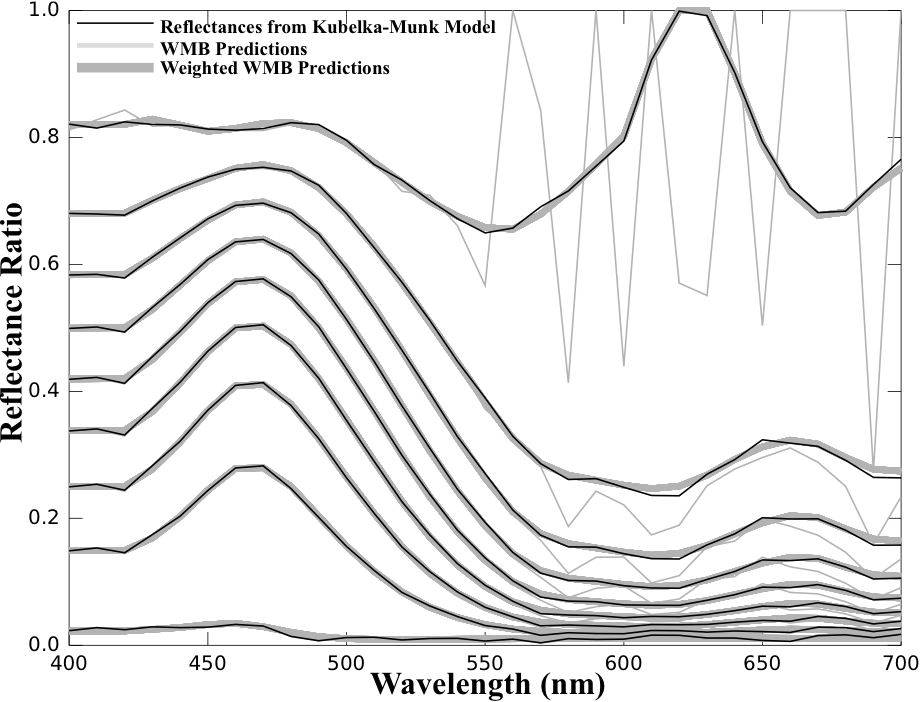
Abstract: The Kubelka-Munk model relates the colours of mixtures to the absorption and scattering coefficients (K and S) of the constituent colorants. A 1987 least squares algorithm by Walowit, McCarthy, and Berns estimates K and S for a set of constituent colorants, from the reflectance spectra of mixtures of those colorants. Their algorithm implicitly weights all the least squares residuals equally. As a result of analyzing residuals and perceptual factors, the current paper recommends a new weighting, called perceptual reflectance weighting. The residuals are shown to follow a probability distribution that depends on S, reflectance level, and reflectance measurement errors. These errors are modeled as an unbiased normal distribution, with the same variance at all reflectance levels. In addition, CIE L* describes how perceptual response depends on reflectance level. Perceptual reflectance weighting combines both these dependencies into one weight. The 1987 algorithm is easily modified, by multiplying each row (except the last) of its coefficients matrix by the appropriate weight, and by using the original estimates of S. An example, taken from practice, illustrates that the new weights can significantly change and improve the 1987 algorithm.
The picture (Fig. 7 of the article) shows the 1987 algorithm (called the WMB algorithm, after its developers, E. Walowit, C. McCarthy, and R. Berns) and the suggested refinement (called the weighted WMB algorithm), applied to a sample data set. This set was simulated to be consistent with the Kubelka-Munk mixture model, and the only error it contains is reflectance measurement error. The weighted WMB algorithm produces more stable results than the 1987 WMB algorithm.
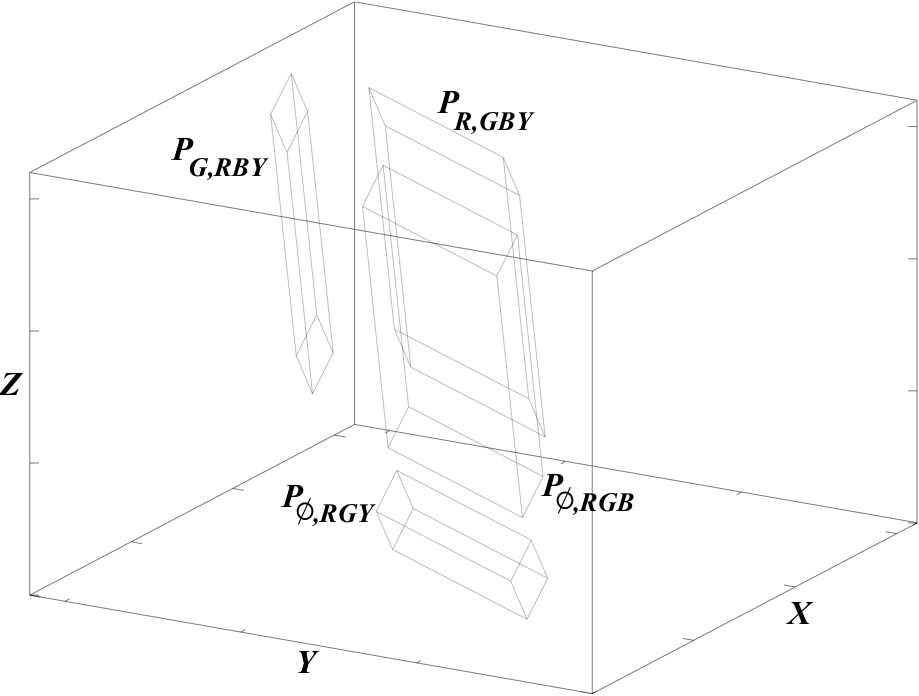
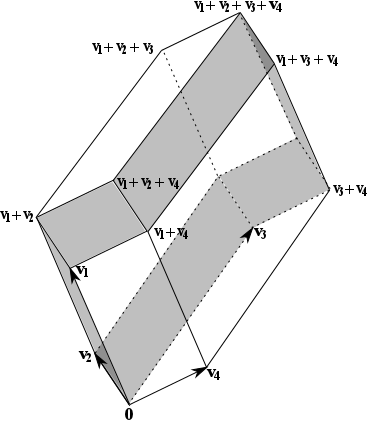
Abstract: A control sequence gives the intensities of the primaries for a pixel in a display. A multi-primary display has four or more primaries, so that multiple control sequences can sometimes produce the same colour. Different primaries likely consume different amounts of energy. A minimal-energy control sequence for a target colour produces that colour with as little energy as possible. This paper shows that such minimal-energy sequences take a simple geometric form. The display gamut, in CIE XYZ space, can be dissected into parallelepipeds. The originating vertex of each parallelepiped is the sum of a set of primaries at full intensity. Each edge of a parallelepiped is the translation of one primary. A colour with XYZ coordinates in a certain parallelepiped is a unique linear combination of the primaries in the originating vertex, and the three edge primaries. This paper proves that there exists a dissection such that these linear combinations are minimal-energy control sequences. In the generic case, this dissection is unique. An algorithm for a minimal-energy dissection is presented, along with an example.
The picture (Fig. 2 of the article) shows an example of an exploded parallelepiped dissection of a four-primary gamut (Figure 2 of the article).
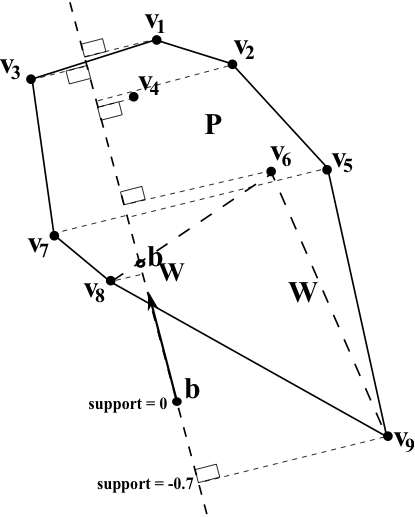
Abstract: The Kubelka-Munk model relates the colours of mixtures to the absorption and scattering coefficients (K and S) of the constituent colorants, and to their concentrations (C) in the mixtures. All K's and S's are non-negative, and C's are physically constrained to be between 0 and 1. Standard estimation procedures cast the Kubelka-Munk relationships as an overdetermined linear system, and apply ordinary least squares (OLS). OLS, however, sometimes produces coefficients or concentrations that are less than 0 or greater than 1. This paper proposes using the Gilbert-Johnson-Keerthi (GJK) algorithm instead of OLS. Not only are GJK solutions always between 0 and 1, but they also satisfy other conditions; for example, concentrations sum to 1. While OLS projects a target vector onto a vector subspace, in fact the set of physically realizable paint combinations is a convex polytope, which is a subset of that subspace. The GJK algorithm finds the point on that polytope that is closest to the target vector. Since it belongs to the polytope, the closest point is physically realizable and satisfies the Kubelka-Munk constraints.
One step (Fig. 4 of the article) in the GJK algorithm, which calculates the closest point between a point and a convex polytope, described by a set of generating points.
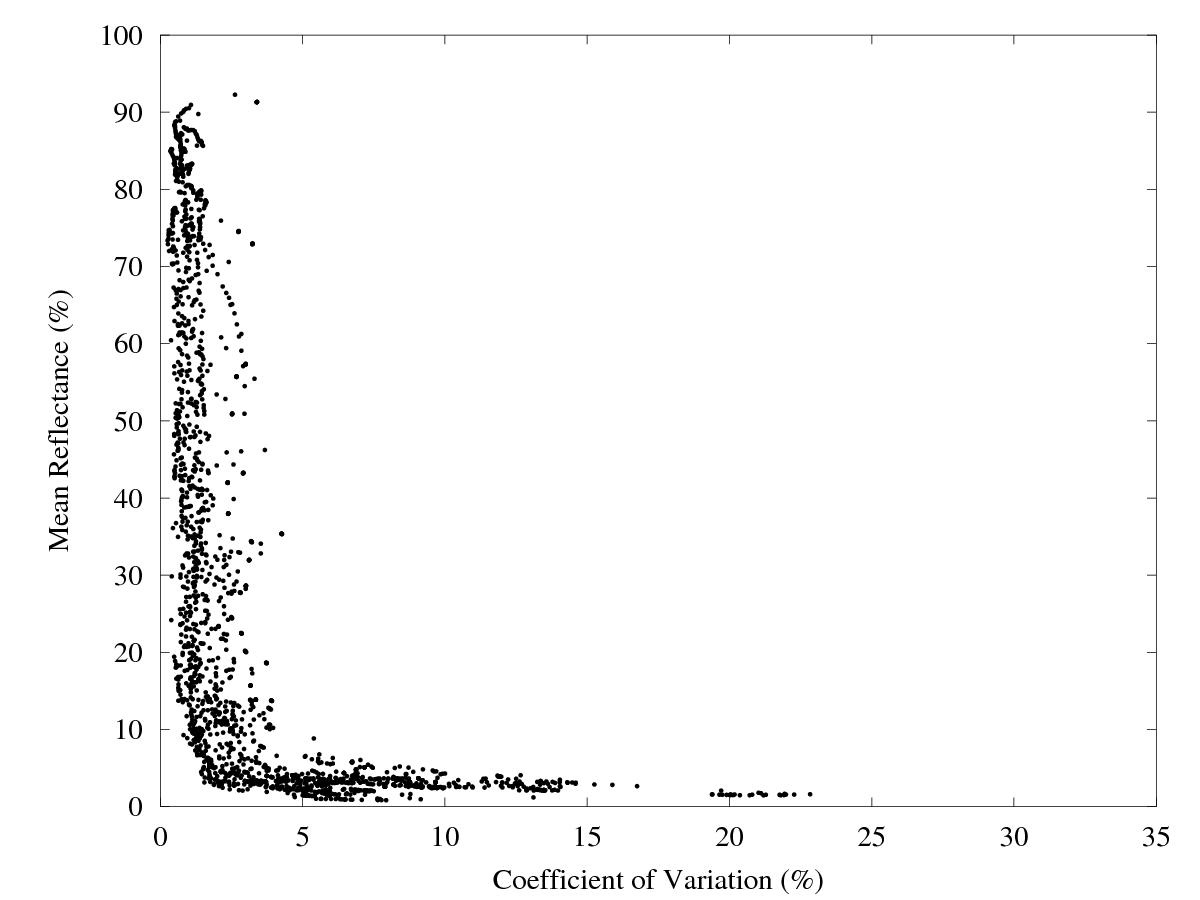
Abstract: The mean colour difference from the mean (MCDM) is a standard measure of spectrophotometric repeatability. This paper proposes a supplementary measure: the coefficient of variation (CoV), which is the ratio of the standard deviation of the measured reflectances to their mean. The CoV is calculated from the same repeated sample measurements as the MCDM. Unlike the MCDM, the CoV depends only on physical quantities, and not on perceptual quantities; furthermore, a CoV is defined for each wavelength. This paper analyzes data from six different spectrophotometer-sample combinations. An important empirical result is that the CoV is nearly constant across wavelengths, except when the reflectance at a particular wavelength is less than about five percent, in which case measurement variability is dramatically greater. Since the MCDM tends to lose this fact through averaging, the CoV is recommended as an adjunct to the MCDM for spectrophotometer analysis and development. The CoV analysis also provides evidence that samples' surface geometry is a major factor in measurement variability.
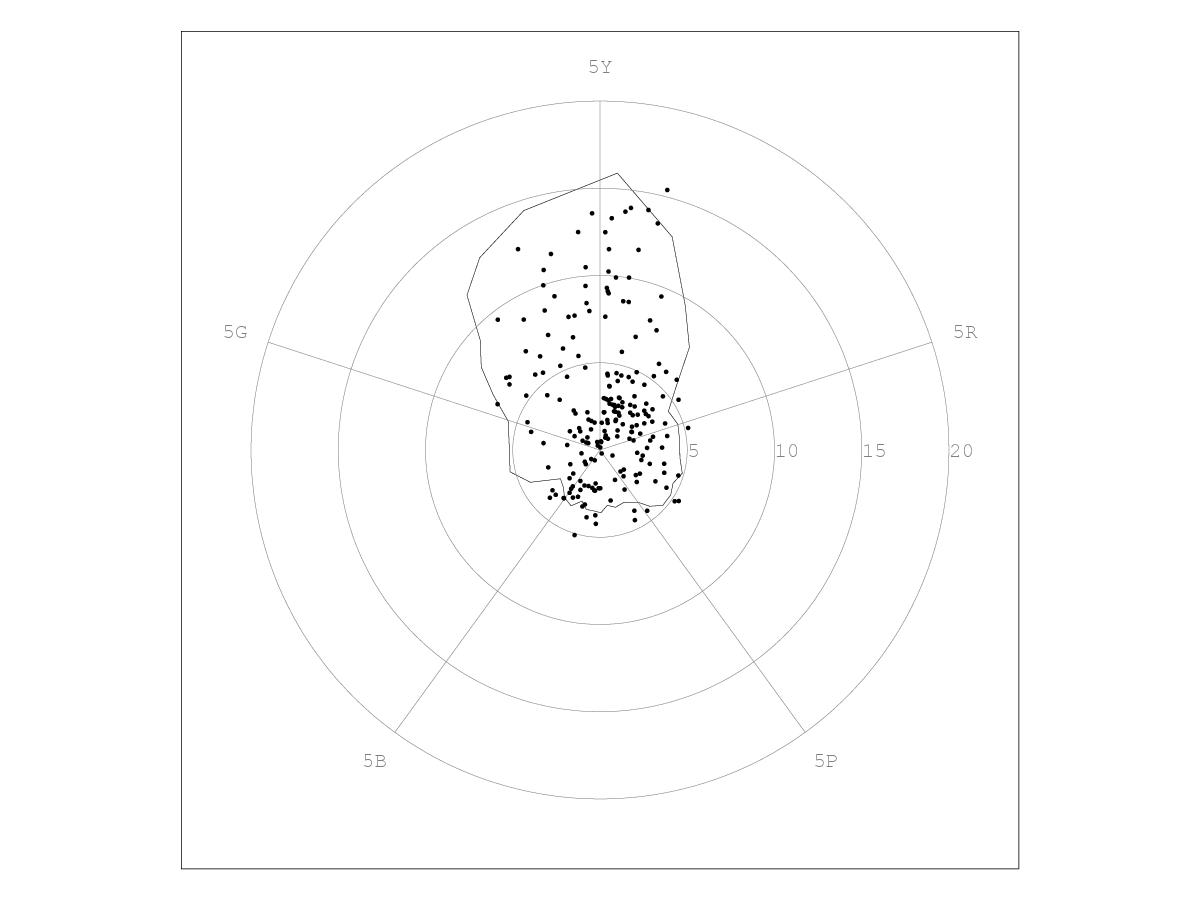
Abstract: Spectrophotometric measurements were made of 3154 artist's chalk pastels, comprising the complete lines of eight brands (Rembrandt, Unison, Sennelier, Schmincke, Girault, Blue Earth, Mount Vision, and Great American). Text files and spreadsheets of reflectance spectra, CIE coordinates, and Munsell specifications, are made publicly available; another file lists which pastels are closest to the Munsell renotation colours. The pastels' gamut was compared to the Pointer gamut of real surface colours, which was converted to Munsell space. The Pointer gamut in Munsell space is also made publicly available. About 65 pastels, mostly light yellows and blue-purples, fall outside the Pointer gamut, suggesting that it can be extended.
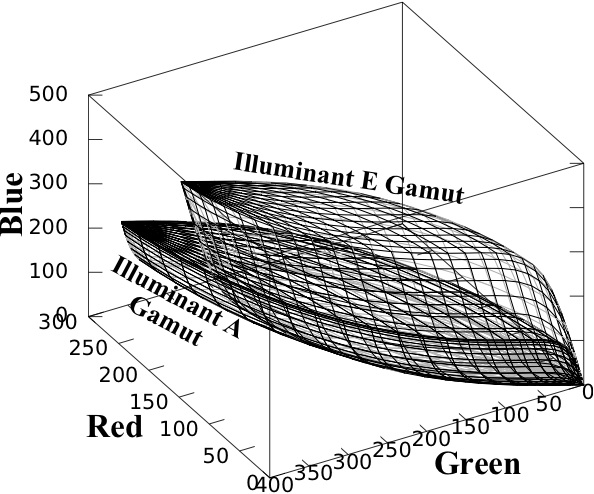
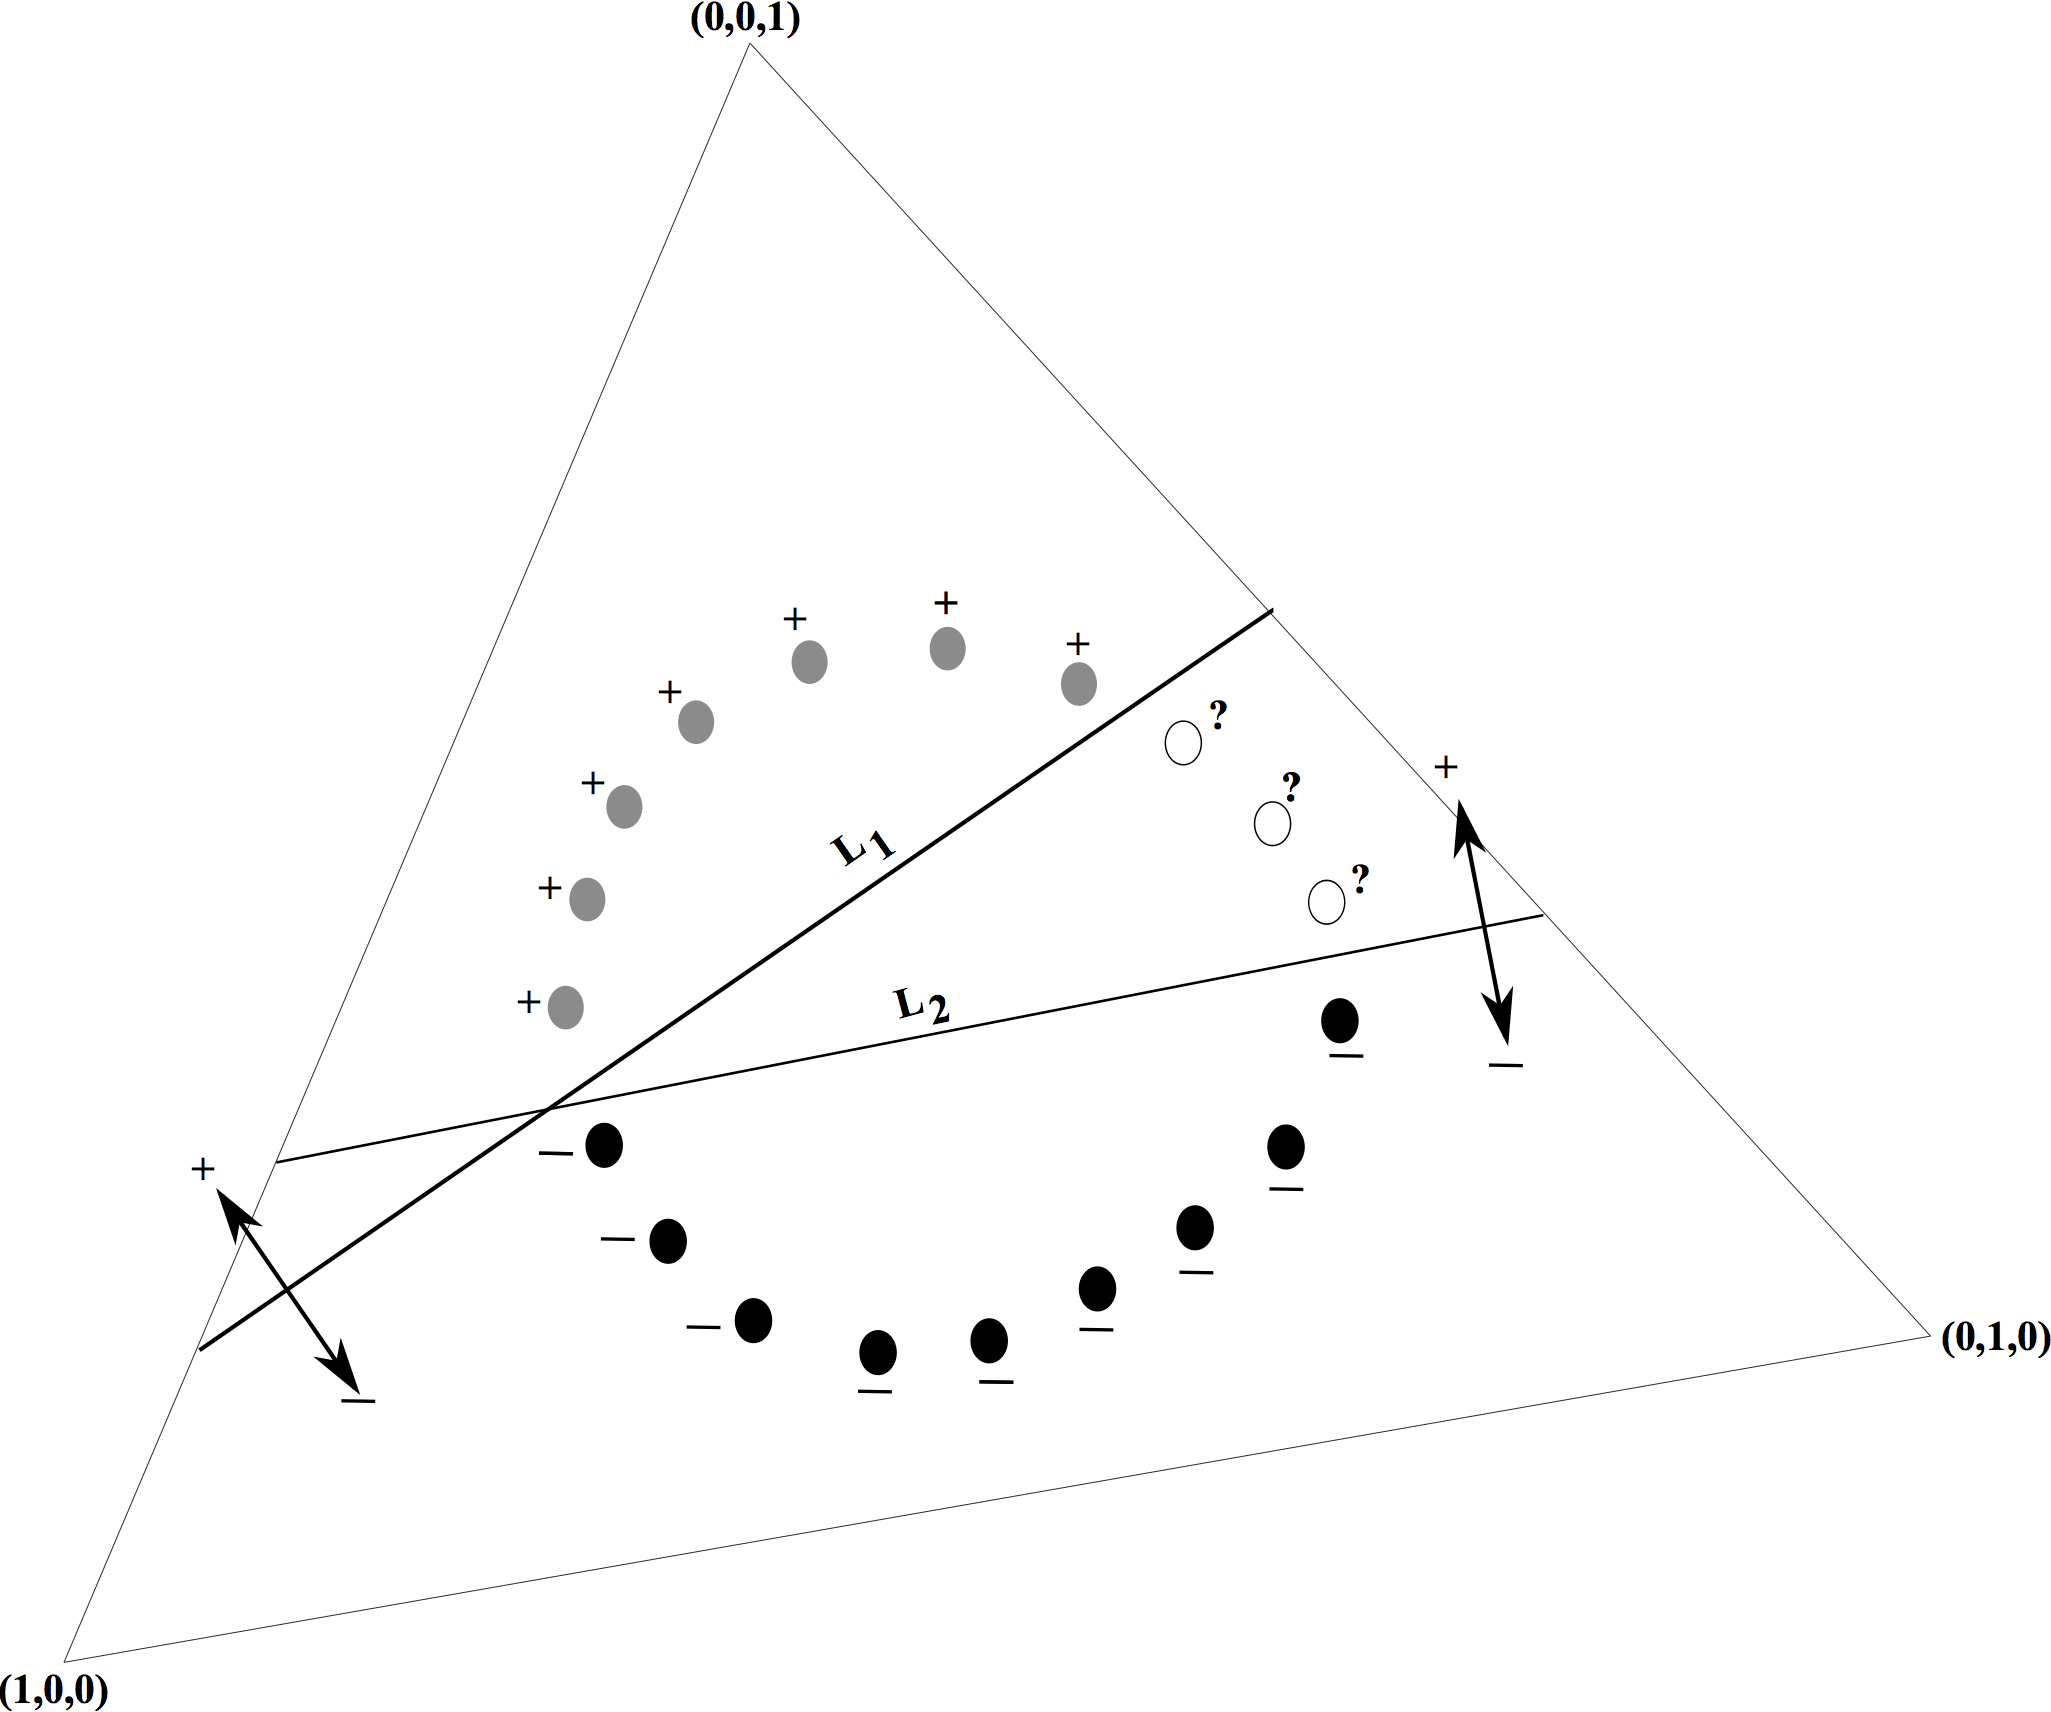
Abstract: Forsyth's 1990 gamut-based illuminant estimation (GBIE) is an important colour constancy algorithm. When a sensing device (assumed to contain three individual sensors) makes an image of physical objects under a single illuminant, GBIE uses the RGB outputs of the image to estimate the illuminant. The set of all RGB outputs in the image is called the image gamut. The set of all RGB outputs that could result when a particular illuminant shines on an object of arbitrary local colour is called the illuminant gamut for that illuminant. Forsyth's algorithm uses the fact that a particular illuminant can be a possible light source for an image only if that illuminant's gamut contains that image's gamut. Implementations to date have used training sets of reflectance spectra to approximate illuminant gamuts. A main result of the current paper is a method for calculating illuminant gamuts exactly, rather than approximating them: geometric constructions prove that illuminant gamuts are zonohedra, and that they are generated by the device's spectrum locus vectors, which are the RGB outputs for monochromatic reflectance spectra. On a more negative note, the same geometric constructions also show that some common GBIE practices are theoretically unsound. In particular, many implementations assume that a linear image of an illuminant gamut is again an illuminant gamut; also, containment tests are sometimes performed in chromaticity space rather than RGB space. The underlying geometry contraindicates both these practices. Finally, a new GBIE algorithm is suggested, that calculates zonohedral gamuts explicitly, avoids contraindicated practices, and takes advantage of the geometry of colour constancy.
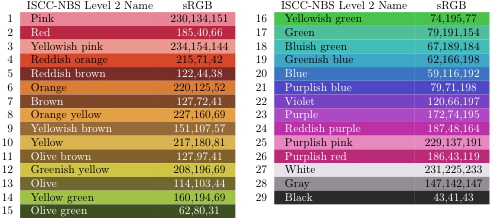
Abstract: The ISCC-NBS colour system specifies 267 colour categories with non-technical names such as ``light purplish pink.'' Computer monitors typically specify colours by red-green-blue (RGB) coordinates, standardized in the sRGB system. This paper presents a detailed technical description of conversions between the two systems. Many sRGB triples fall in a particular ISCC-NBS category; the centroid of all such triples, calculated with respect to a Euclidean metric on sRGB space, is taken as the most representative sRGB for that category. The conversion uses the Munsell system as an intermediary. ISCC-NBS categories, which apply to object colours, are not immediately compatible with sRGB coordinates, which apply to light sources. To achieve compatibility, it is assumed that an sRGB monitor is viewed under Illuminant C (the standardized illuminant for Munsell and ISCC-NBS), at intensity levels that make the monitor's colours appear as object colours. The paper's practical results include a simple lookup table for the centroids, and some open-source code for further development.
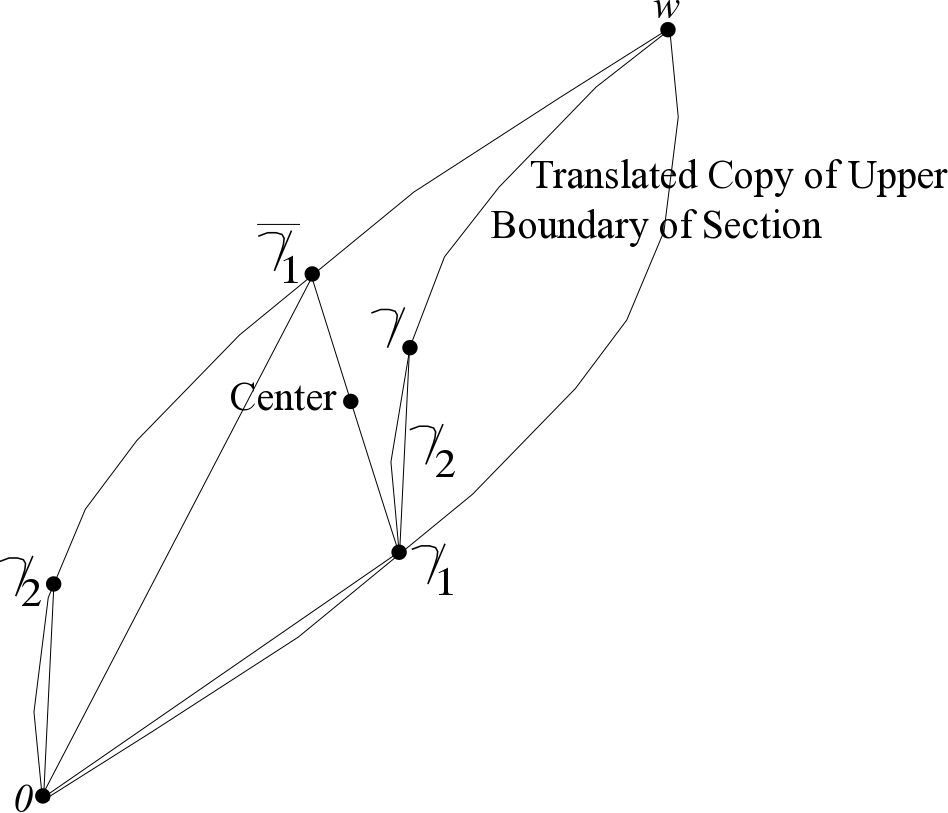
Abstract: Suppose that two different imaging devices produce two colour images of the same physical object, or that one device images the same object under two different illuminants. A metamer mismatch occurs when two colours are identical in one image, but different in the other image. Each colour output in the first image could have been produced by a large set, called a metamer set, of reflectance spectra. In the second image, the metamer set might produce a wide variety of colour outputs, referred to in their entirety as a metamer mismatch body (MMB). This article presents a simple algorithm for constructing an MMB, by expressing its vertex in an arbitrary direction as a solution to a linear programming program. The algorithm finds not only vertices, but also the reflectance spectra that, when imaged by the second device, produce those vertices. Geometric and algebraic structures behind the algorithm are defined and analyzed in detail. While the linear programming approach to MMBs is not new, the current paper aims to make it accessible, rigorous, and easy to use; to this end, there is an accompanying open-source Octave/Matlab implementation, containing about 30 source lines of code.
Abstract: It is known that a reflectance spectrum for an optimal colour takes on the value 0 or 1 at every wavelength, with at most two transitions between those values. This paper shows that any non-optimal colour can be produced by a reflectance spectrum that takes on the value 0 or 1 at every wavelength, with at most four transitions. While the two-transition optimal spectrum is unique, the four-transition non-optimal spectrum is not unique.
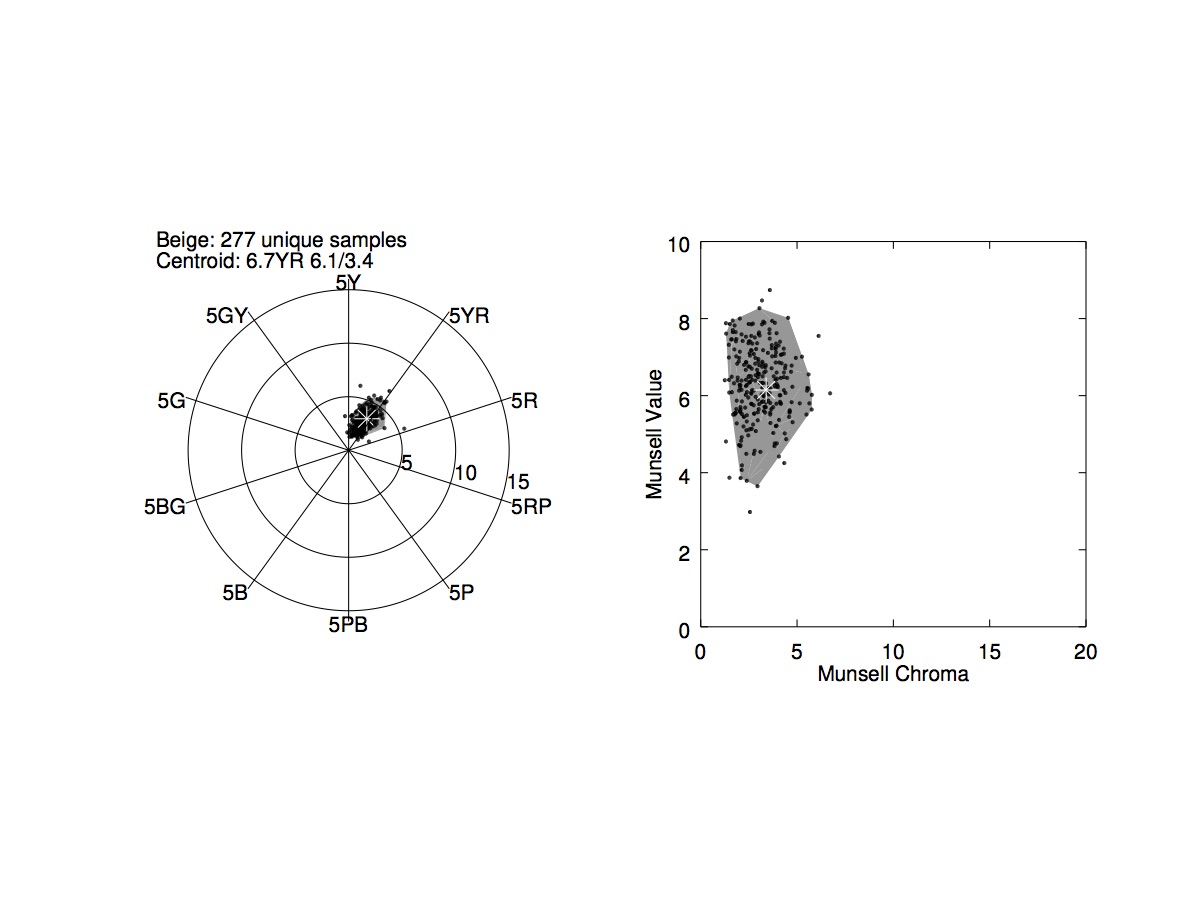
Abstract: Many common surface colour names such as
beigelack technical definitions. This paper uses a data set of about 16,000 reflectance spectra of named physical samples, collected by the Color Association of the United States (CAUS), to infer definitions for 20 common non-basic surface colour names (aqua, beige, coral, fuchsia, gold, lavender, lilac, magenta, mauve, navy, peach, rose, rust, sand, tan, taupe, teal, turquoise, violet, wine), as well as Berlin and Kay's basic names (excepting black). A convex polyhedron in the Munsell tree is constructed for each name. Any colour inside the polyhedron, and only such a colour, is described by that name, with the implicit understanding that the polyhedron's boundaries are inherently fuzzy; the polyhedron's centroid can be taken as the name's focal colour. Accompanying files make the polyhedra publicly available. The current analysis is unique in using a three-dimensional definition, in its large number of surface colours, and in its inclusion of non-basic surface colour names. After presenting the analysis results, comparisons are made to other investigations of naming.
Abstract: Optimal colours for human vision occur on the boundary of a three-dimensional object-colour solid, and result from optimal reflectance spectra, that take on only the values 0 and 1, with at most two transitions between those values. Different illuminants lead to different solids. If there are two illuminants and a single sensing device, then we can construct a six-dimensional double object-colour solid by concatenating colour signals from both illuminants. Colours on the boundary of a double-object solid, and the spectra that generate them, can also be called optimal. This paper shows that, while optimal spectra for double solids take on only the values 0 and 1, there is no maximum number of transitions between those values: given a device, we can always construct two illuminants such that the resulting double object-colour solid has an optimal reflection spectrum with as many transitions as desired.
Abstract: Colour-matching functions (CMFs) in standard colour-matching experiments consistently peak at three wavelengths, known as the Thornton primaries. This paper derives the CMFs' peaks from a geometric construction, the unit-power hull U, whose shape explains the observed consistency. The spectrum locus vectors consist of all the colours (as vectors in three-dimensional colour space) that arise from single-wavelength spectral power distributions (SPDs) of some unit power. The convex hull of the spectrum locus vectors will be called the unit-power hull U; it is the set of all colours that can be produced with unit power or less. Now choose three monochromatic SPDs (reasonably spread out over the spectrum) for a colour-matching experiment; equivalently, assign a basis to three-dimensional colour space. To find the peak for one primary's CMF, use the vectors for the other two primaries to generate a plane in colour space. Parallel-translate that plane across U; the farthest possible translation point is the tip of the spectrum locus vector for the peak wavelength of the first primary's CMF. The relative pointedness of U at these vertices limits the set of farthest points to three narrow wavelength bands, centered on the Thornton primaries.
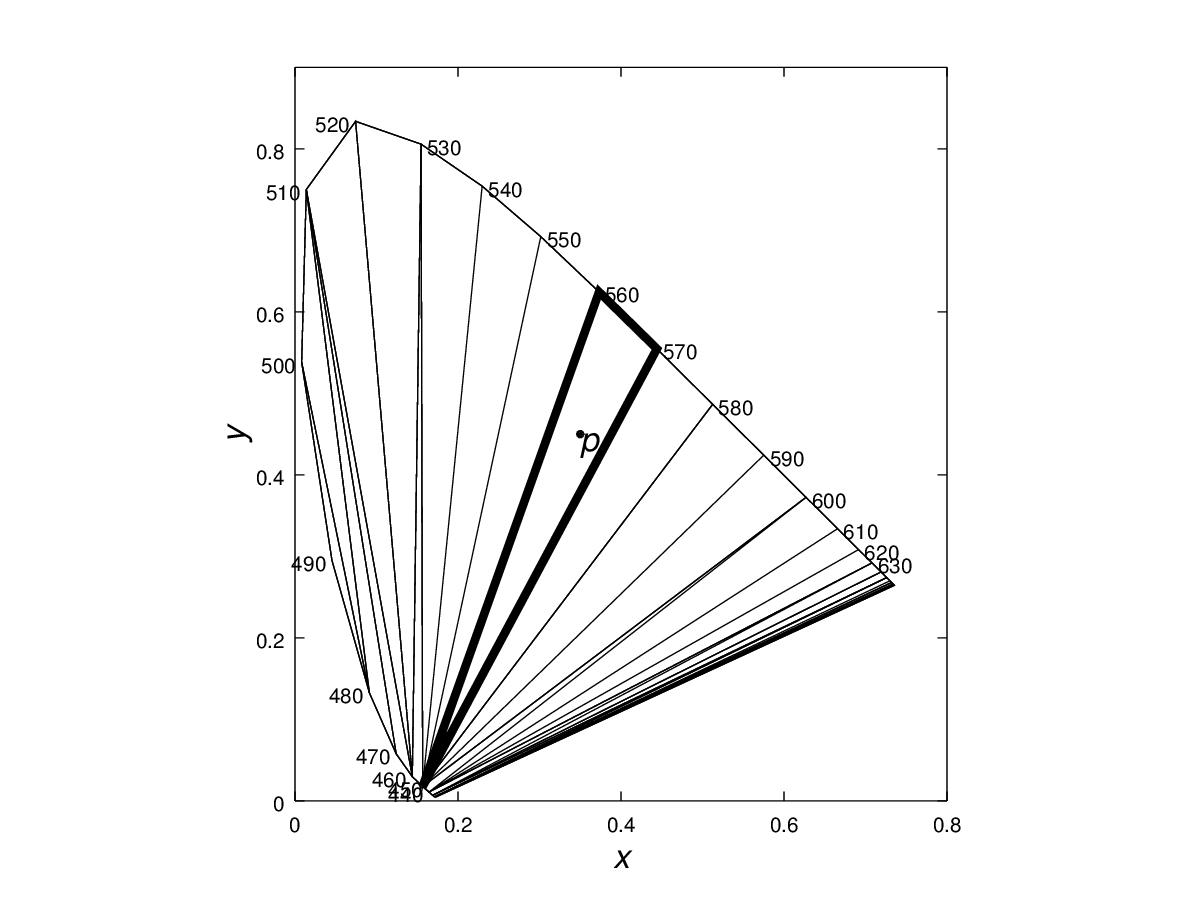
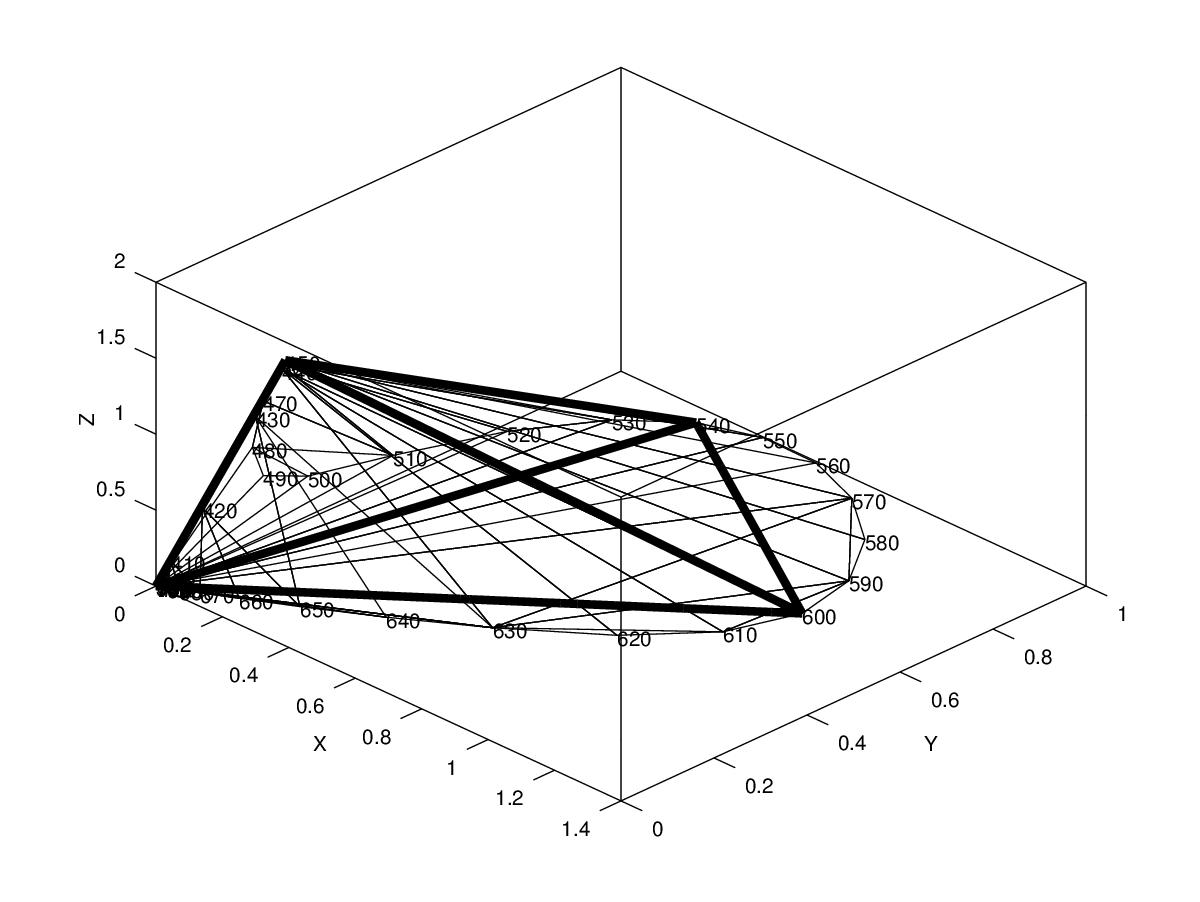
Abstract: The same colour perception can be produced by many different spectral power distributions (SPDs), called metamers. This paper shows geometrically that the minimal-power metamer for a target colour has power at only two wavelengths. In three-dimensional colour space, the spectrum locus vectors are the colours that arise from unit-power, single-wavelength SPDs. Their convex hull, which we will call the unit-power hull U, consists of all colours that can be produced with unit power or less. An equivalent problem to finding a minimal-power metamer is finding the SPD at which a given chromaticity achieves a maximum luminance, using only one unit of power. The colours of one chromaticity lie on a ray from the origin and achieve maximum luminance (for one unit of power) at the point p where the ray exits U through a triangular face. With a discretized spectrum, convexity arguments imply that the minimal-power SPD for p has power at only three wavelengths, one for each of the triangle's vertices. As the discretization interval goes to 0, two of the wavelengths asymptotically approach each other, meeting ultimately at a single wavelength, so that a continuous minimal-power metamer has power at only two wavelengths.
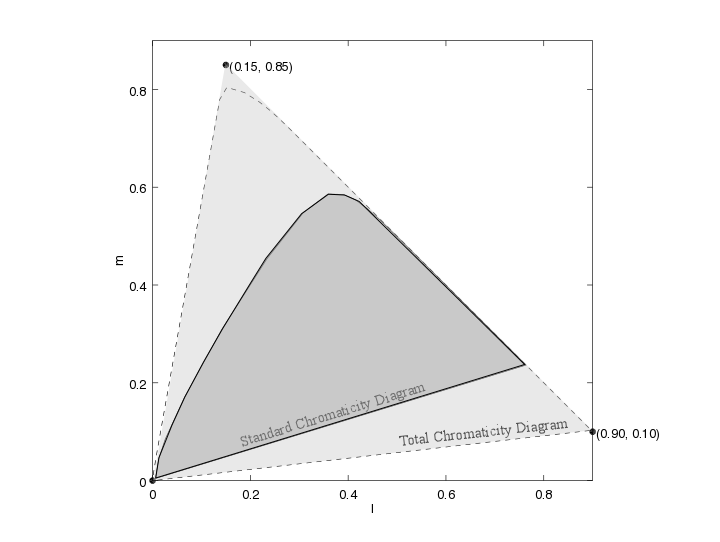
Abstract: The familiar chromaticity diagram consists of all the chromaticities that can be perceived in what might be called a state of neutral adaptation. In the von Kries model, different states of chromatic adaptation modify the retinal cones' responses, which in turn modify the perceived chromaticities of colour stimuli. This paper demonstrates mathematically that, in fact, each state of adaptation has its own chromaticity diagram (with significant overlap between the diagrams). The von Kries model is shown to predict that these new diagrams contain some colours that are outside the ordinary chromaticity diagram. This observation then necessitates enlarging the standard chromaticity diagram into a total chromaticity diagram, consisting of all chromaticities, that can occur in any adaptive state. The total diagram, which is calculated explicitly, is a superset of the standard diagram, and is approximately triangular in cone-fundamental space. As an application, the new diagram helps explain the high chromas sometimes seen in the Helson-Judd effect.